T, 9/30: Workshopping letter drafts

Today you were asked to bring 5 copies of your job ad/cover letter and 5 copies of your claim letter. We’re going to do something akin to peer-review as speed dating.

  1. We’re going to divide the class into two groups. Then, each group will divide in half, forming two even, concentric circles. Like this:

2. Those in the outside circle will exchange drafts with those in the inside. Each pair has 5-10 minutes to review each other’s claim letters and share feedback. As you review your partner’s letter, be sure to write down comments, questions, ideas, etc. in the margins. As you do, keep in mind the criteria we developed in class for this genre. After the 5-10 minutes are up, you’ll give each other your letters back.

3. The outside circle with then rotate one seat over, clockwise and repeat step 2.

4. Once everyone has had a chance to review your claim letter (about 30-40 minutes), we’ll switch circles so that the outside circle in Group 1 will switch with the outside circle in Group 2. This way, we’ll be able to diversify feedback.

5. Repeats steps 2-3 with your cover letters.

Th, 9/25: Cover letters, cont’d

Today we’ll slow down a little bit and look at two more sample job ads and letters of response (although digital copies are available below, I printed out copies so you can write on them).

But first I’ll also share the Tech Briefing schedule with you and walk you through the Instructions Project.

On Tuesday, I’d like you to bring 5 draft copies of your cover letter (w/ job ad) and 5 draft copies of your claim letter. We’ll workshop these in class.

Th, 9/11: Audience analysis (memos)

Today we are primarily focused on workshopping your memos, which we’ll do in stages.

First, you’ll first spend 5 minutes individually reading Group 1’s memo and data. Next, you’ll spend 5 more minutes sharing your thoughts in small groups and commenting on the memo. We’ll then reconvene as a large group for 5 more minutes to debrief. We’ll repeat this process with Group 2 and so on. Because I uploaded each memo to Google Docs, you should be able to make comments and edits right in the doc, which everyone can see. I’ll show you how to use these features before we start. Here are the memos and data:

Group 1 –social media in the workplace: [memo] [data]
Group 2 –cloud-based options: [memo] [data]
Group 3 –video conferencing: [memo] [data]
Group 4 –online collaboration sites/software: [memo] [data]
Group 5 –web design: [memo] [data]

As you read these, consider the following process:

  1. First, individually read the data a few times. Then, ask yourself: what does the data say? What does it not say? That is, what can it not tell me?
  2. Then, read through the memo. What does the group focus on? Was is the same points you saw? Different? In other words, how did the group interpret this data? Do you agree with it?  Are there are there alternative explanations for the data? Does the data ever make interpretation difficult?  Discuss these questions in your small groups.
  3. Finally, think about how you might actually use this data as someone who will be graded on making a case for a certain kind of tech briefing. Would this memo be helpful in making that case? Let this question guide many of your comments.

T, 9/9: Audience Analysis (data)

Today we are aiming to get through 3 tasks and start a 4th, all dependent on your surveys. Remember, we are meeting in HBC 227 today!

1. Take surveys. Below you’ll see links to each group’s survey. Sign in to one of the computers in the cluster or use your own to take every survey, including your own. This should take no longer than 20-25 min.

Links:
Group 1 (social media in the workplace):  https://docs.google.com/forms/d/1pxsW2SBSygPKWS0fOxYq3BCbsmqpA0yuBlAfCUTt7Bs/viewform?usp=send_form

Group 2 (cloud-based options): https://docs.google.com/forms/d/1SB2EKIocQ8sqDQMiFVhDQHZU5tuabeFu0_RjyspVwGo/edit?usp=sharing

Group 3 (video conferencing): https://docs.google.com/forms/d/1U-R3ZSMvzmdCT_3tKWNFjj6kkGjzGl8lTxsk-LLhcdo/viewform?c=0&w=1&usp=mail_form_link

Group 4 (online collaboration sites/software):  https://docs.google.com/forms/d/1gaV4LBsoGnfXImstIWPipzYzPbLAErdqRd5FwLlUvuw/viewform?c=0&w=1&usp=mail_form_link

Group 5 (web design):  https://docs.google.com/forms/d/1b2eg8f89SvcXhpJbPmNuHdk0OmbuzHHb16cMe5lnYvs/viewform?usp=send_form

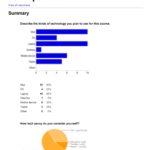
2. Process your data. Once everyone has taken all the surveys, work together with your group to view the “summary of responses” in Google Forms (to access this, go to the Form menu). Although the raw data is available in spreadsheet form, the bonus feature with Google Forms is that it will visualize the data with charts or diagrams. Look over this data with your group. It might help to look at Guideline 3 on p198 in Technical Communication. Specifically this table:

strategies

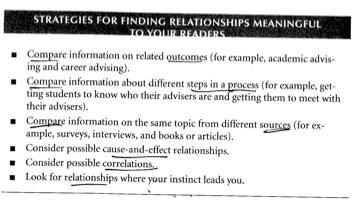
3. Interpret your data. As you discuss how to make sense of your data, make room for alternative explanations (p199) and uncertain conclusions (p200). Ultimately, consider how the patterns and possibilities will affect your readers’ upcoming decision: to propose a tech briefing to the class. Explain the significance of your data and entertain some recommendations based on this.

4. Draft a memo. Before next class, send the class a pdf of a memo that summarizes your survey results and makes recommendations, drawing from some of the methods discussed in Chapter 7.  Use the format on pp 550-52 to help you design it. This memo should communicate key insights from your survey; that is, those that are most relevant to the next task: proposing a tech briefing project. As you do this, keep your audience in mind; you should ask yourselves: how could our data be useful to our peers as they consider drafting a TB proposal? This doesn’t mean you should ignore specifics (i.e. the data), but should think carefully about how your are ordering information in your memo. In fact, be sure to attach a pdf of the “summary of responses” — the visualized data — so the class can scrutinize your interpretations.